S&P 500 INDEX MODEL TRADING PLANS for MON. 08/21 In our trading plans published Thu. 08/17, we wrote: “The index is approaching the 4400 level this morning. If it breaks down, then 4385 will be the next support”. The index closed below that level on Thursday, and took down multiple support levels since then, and (more…)
THE GIST (“THE WHAT”) Rising yields and fears of contagion from China’s emerging property crisis kept sentiment low. Opening lower following reports of Chinese builder Evergrande’s bankruptcy, the S&P 500 index managed to claw back most of the day’s losses to close the session mostly flat at 4369.71, down fractionally by 0.65 point (-0.015%). Note: Our (more…)
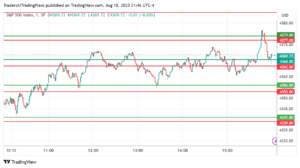
Results of Published Model Trades for Fri 08/18 Find below the detailed outcome tracking of our models’ trading plans for the day, as well as the results for the last month. The horizontal lines on the chart show the price levels corresponding to the trading plans as published in the morning. (Please click here to (more…)
S&P 500 INDEX MODEL TRADING PLANS for FRI. 08/18 To start the week, our trading plans published on Monday, 08/14, stated: “The level of 4495-4505 is now the immediate key level for both Support and Resistance. 4445-4452 is the next support level, a daily close below which will turn our models cautiously bearish”. On Wednesday, (more…)
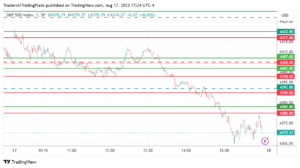
Results of Published Model Trades for Thu 08/17 Find below the detailed outcome tracking of our models’ trading plans for the day, as well as the results for the last month. The horizontal lines on the chart show the price levels corresponding to the trading plans as published in the morning. (Please click here to (more…)
Trading Plans for THU. 08/17 – Key Support Level Being Tested
S&P 500 INDEX MODEL TRADING PLANS for THU. 08/17 Our trading plans published on Monday, 08/14, stated: “The level of 4495-4505 is now the immediate key level for both Support and Resistance. 4445-4452 is the next support level, a daily close below which will turn our models cautiously bearish”. Yesterday, this level was breached. We (more…)
THE GIST (“THE WHAT”) The S&P 500 index extended losses for the second session in a row, registering a five-week low after hawkish FOMC meeting minutes showed that while policymakers are united in their resolve to bring inflation to their target annual rate of 2%, they remain divided on whether to pause rate hikes (more…)
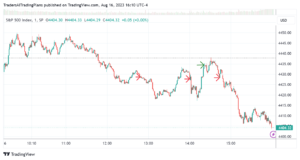
Results of Published Model Trades for Wed 08/16 Find below the detailed outcome tracking of our models’ trading plans for the day, as well as the results for the last month. The horizontal lines on the chart show the price levels corresponding to the trading plans as published in the morning. (Please click here to (more…)
S&P 500 INDEX MODEL TRADING PLANS for WED. 08/16 Our trading plans published on Monday, 08/14, stated: “The level of 4495-4505 is now the immediate key level for both Support and Resistance. 4445-4452 is the next support level, a daily close below which will turn our models cautiously bearish”. This support level is tested on (more…)
THE GIST (“THE WHAT”) The S&P 500 index broke below its 50-day moving average, a closely watched gauge of momentum, for the first time since March, led by weakness in bank stocks. Losses accelerated during the last hour of the session alongside rising yields. The index closed the session near day’s lows at 4437.85, down (more…)