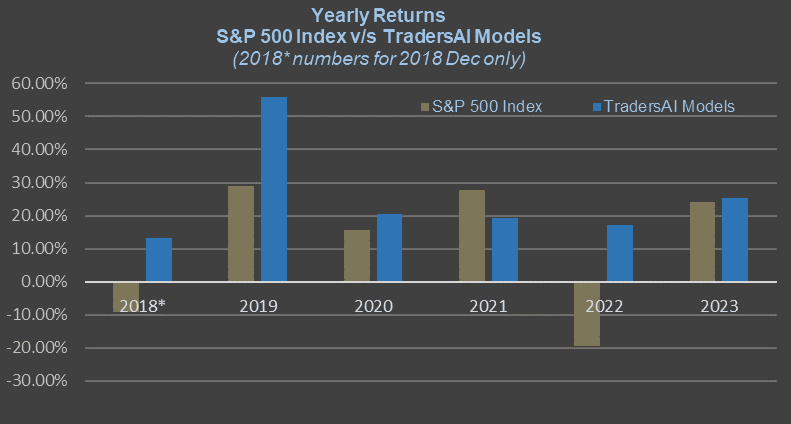
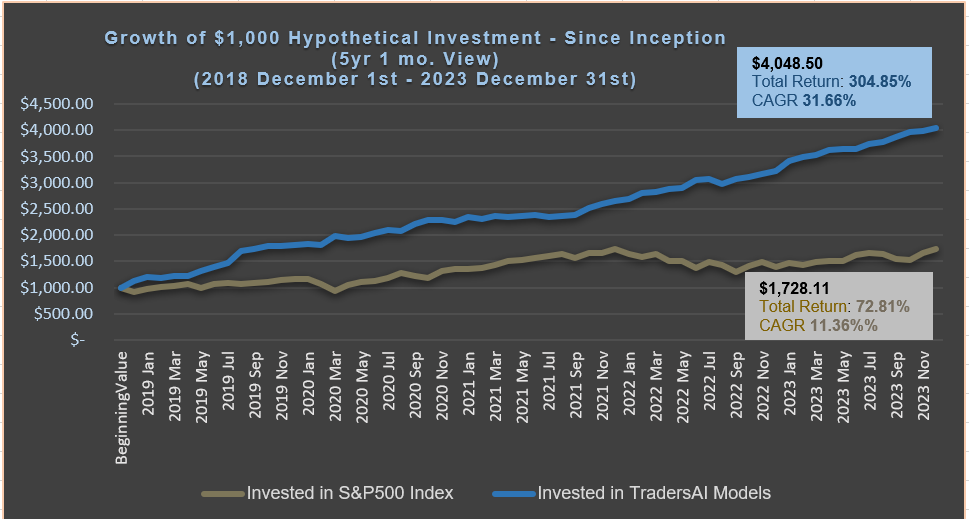
Is That a Real Bull in Sight? Not so Fast – Price Action till Monday Close Needed to Gain Clarity and Conviction!
Since Wed, 01/09, our models adopted a bullish bias which will be invalidated if the index registers a daily close below 2585. The index is yet to break above the 2645 level on a daily close basis, but if it does so on a daily close basis then the next level would be 2675 followed by the 2700 level. However, our models point to a potential consolidation of the recent run up before further upside. A daily close below 2585 is needed to negate the bullish bias.
Below, you will find our models’ trading plans for today:
Trading Plans for FRI, 01/18:
NOTE : The index by itself is NOT tradable. The model plans here based on the S&P index level can be used to trade any instrument that tracks the index – the futures on the index (ES, ES-mini), the options on the futures (ES options), the SPX options, the ETF SPY are just a few examples of the instruments one can adapt these plans to. These plans are NOT an investment advice to buy or sell any specific securities but are intended to aid – as informational, educational, and research tools – in arriving at your own investment/trading decisions. Always consult a Financial Advisor before making your investment/trading decisions if you are not knowledgeable about these markets.
Medium-term/long-term Models: For today, Friday 01/18, our medium-term models indicate waiting for a daily close to form the next directional bias. Hence, the models would stay flat for the day.
Aggressive Intraday Models: For today, Friday 01/18, our aggressive intraday models indicate going long – with an 8-point trailing stop – on the index crossing above 2652. Models would go short – with a 10-point trailing stop – on a break below 2632. For these trades to trigger, the breaks should occur within the regular session hours. Once a trade is opened and closed through a trailing stop, the models would stay flat for the rest of the session.
Due to the intraday nature of these aggressive models, they indicate closing any open trades at 3:50pm and remaining flat into the session close.
IMPORTANT RISK DISCLOSURES AND NOTICES – READ CAREFULLY:
(iii) Risk Warning: Investing, trading in S&P 500 Index – spot, futures, or options or in any other synthetic form – or its component stocks carries inherent risk of loss. Trading in leveraged instruments such as futures carries much higher risk of significant losses and you may lose more than you invested in them. Carefully consider your individual financial situation and investment objectives before investing in any financial instruments. If you are not a professional trader, consult a professional investment advisor before making your investment decisions.
(iv) Past performance: This article may contain references to past performance of hypothetical trades or past forecasts, which should NOT be taken as any representation or promise or guarantee of potential future profits. Past performance is not indicative of future performance.
(v) The author makes no representations whatsoever and assumes no responsibility as to the suitability, accuracy, completeness or validity of the information or the forecasts provided.
(vi) All opinions expressed herein are subject to change at any time, without any notice to anyone.


