Bulls Weak But Not Out! Can Bears Step Up Their Attack?
S&P 500 Index witnessing a dog-fight between the bulls and the bears with alternate losses to each side in the last two days. The action today was almost a mirror image of the action yesterday – the index broke through strong support levels to reach 2691.99 early in the session, only to recoup all the losses and close up 16+ points at 2716.31!
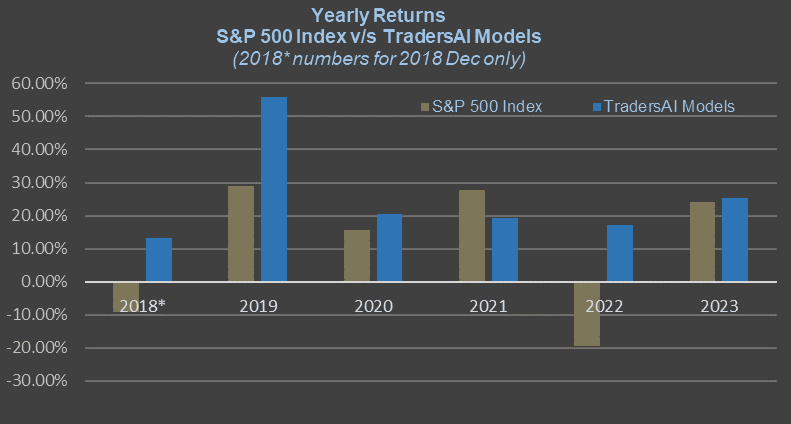
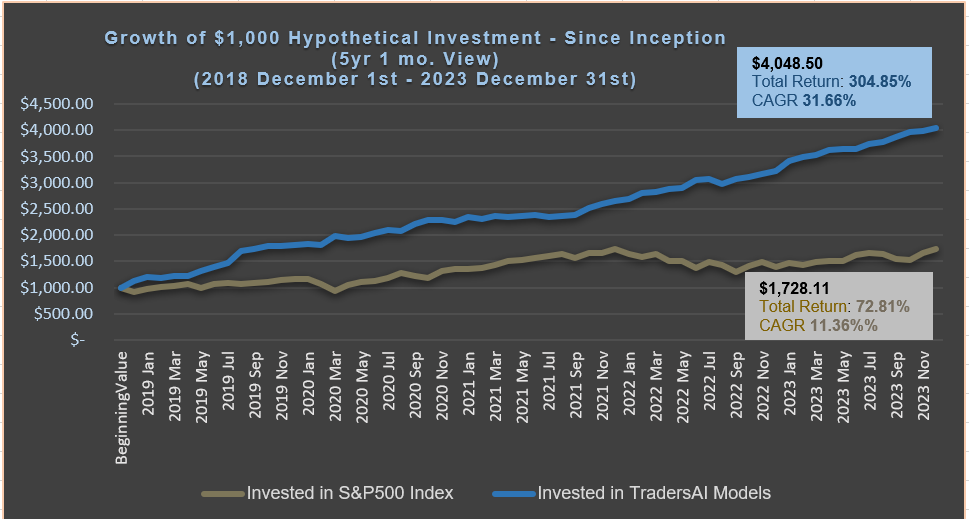
Our Intraday Alert published at 2:54pm EDT today said “Our Models are now long (bought) at 2715.50, on the break of S&P 500 Index above the 2715 level. Intraday/aggressive models have a profit target at 2724.50 and a stop-loss at 2710″ (please click here for the full report). It is to be noted that, within the next 25 minutes, the index did indeed rose to test that take-profit level by registering the session high at 2724.34!! As if, the market is watching our proprietary take-profit level and avoiding hitting it (NO, it does NOT work that way – any one single trader/institution’s trading levels are too insignificant to influence the market directly). This again goes in the record of our models’ accurate performance that is repeating often these days – yet, it is to be noted that these models can NOT be expected to consistently work this well.
Further, our forecast for today (Thu, 06/28) mentioned: “Bears have to push the index to a daily close below 2690 for an extended push into the bear territory, failing which could lead to an extended period of another tug-of-war around the 2700 region”. The index today did indeed attempt to test that bear strength – the low reached 2691.99 – just under two points within the key level our models indicated – but failed to take out that level. And, as the models predicted, that failure was followed by a steep rise from there all the way to 2724+!
Regular readers must have gotten used to this kind of predictive power of our models, and we hope that they are able to take advantage of such predictive models to fine tune their own trading approach and results!
Model Biases/Outlook:
Both the medium-term and short-term models’ recent bullish bias was negated last Thursday after noon (click here for our report published on that day), and the bias was slightly bearish to start the week. Monday’s bearish action confirmed the bearish bias and now the models are outright bearish, which is reiterated for the 4th day in a row.
Trading Plans for FRI, 06/29/2018:
Medium-to-long term investors
The medium term models are now flat, waiting to open a fresh short (sell) on a break below 2690. Taking a false short was averted because of the accuracy of this number – the index reached a low of 2691.99 but never breached the 2690 level, hence there were no positions taken on the short side today.
Meidum-term models indicate bearish bias below 2715, but indicate no new short selling while above 2690. The models indicate no long bias until at least a daily close above 2740 (slightly bullish) or above 2755 (outright bullish) with tight stops.
Meidum-term models indicate bearish bias below 2715, but indicate no new short selling while above 2690. The models indicate no long bias until at least a daily close above 2740 (slightly bullish) or above 2755 (outright bullish) with tight stops.
Aggressive, short term, intraday, or professional traders
Those who followed our intraday models should have made decent profit on the long position taken on the break above of 2715, and either closed it around the 2724 (stop was indicated at 2724.50 but those who put it more conservatively at around 2724 would have booked their profits right at the peak) or are sitting on a profitable long (as of now, 8:20pm EDT, the futures markets show e-mini futures at 2722.25, or an equivalent index level of around 2720).
If still holding the long, models indicate raising the stop-loss to 2714, to protect the position from any steep losses overnight (if trading the strategies through the overnight futures). Our aggressive, intraday models are currently flat, getting out on the break below 2720 from the peak of 2724.34.
For Friday, the aggressive/intraday models indicate indeterminate bias between 2720-2700 – stay flat between these levels. Above 2720, long bias with very tight stops/trailing stops (5 to 8 points, to make sure the models don’t get stuck in swiftly losing positins on a Friday). Below 2700, short bias with a trailing stop of 5 to 8 points.
IMPORTANT NOTICES & DISCLAIMERS – READ CAREFULLY:
(i) This article contains personal opinions of the author and is NOT representative of any organization(s) he may be affiliated with. This article is solely intended for informational and educational purposes only. It is NOT any specific advice or recommendation or solicitation to purchase or sell or cause any transaction in any specific investment instruments at any specific price levels, but it is a generic analysis of the instruments mentioned.
(ii) Do NOT make your financial investment or trading decisions based on this article; anyone doing so shall do so solely at their own risk. The author will NOT be responsible for any losses or loss of potential gains arising from any investments/trades made based on the opinions, forecasts or other information contained in this article.
(iii) Risk Warning: Investing, trading in S&P 500 Index – spot, futures, or options or in any other synthetic form – or its component stocks carries inherent risk of loss. Trading in leveraged instruments such as futures carries much higher risk of significant losses and you may lose more than you invested in them. Carefully consider your individual financial situation and investment objectives before investing in any financial instruments. If you are not a professional trader, consult a professional investment advisor before making your investment decisions.
(iv) Past performance: This article may contain references to past performance of hypothetical trades or past forecasts, which should NOT be taken as any representation or promise or guarantee of potential future profits. Past performance is not indicative of future performance.
(v) The author makes no representations whatsoever and assumes no responsibility as to the suitability, accuracy, completeness or validity of the information or the forecasts provided.
(vi) All opinions expressed herein are subject to change at any time, without any notice to anyone.


