Start of a New Trading Month After Three Consecutive Losing Weeks! Will the Bulls Show Up on Monday?
S&P 500 Index has seen three consecutive losing weeks, with lower lows and lower highs. The action on last Thursday showed potential bull reaction, followed by consolidation on Friday. The bulls are weak while the bears are facing formidable support level along the 2695-2705 band. It is likely that this band will act as the pivot level for the bulls and bears to launch fresh attacks on each other this week. Who can push the index in which direction and how far away from this band would determine the market’s directional bias this week.
Model Biases/Outlook:
As we published ten days back, both the medium-term and short-term models’ recent bullish bias was negated last Thursday after noon (click here for our report published on that day). Last week’s market action confirmed the bearish bias and now the models are outright bearish, which is reiterated for the 6th day in a row.
For Monday, the models indicate the risk tilted towards a move up to test the 2735-45 region before further directional bias could pull the index in either direction. This is especially applicable to the overnight futures market. Thus, caution is advocated when opening short positions early in the session or during the overnight futures session.
Trading Plans for MON, 07/02/2018:
Medium-to-long term investors
The medium term models are now flat, waiting to open a fresh short (sell) on a break below 2690. Meidum-term models indicate bearish bias below 2715, but indicate no new short selling while above 2690. The models indicate no long bias until at least a daily close above 2740 (slightly bullish) or above 2755 (outright bullish) with tight stops.
Aggressive, short term, intraday, or professional traders
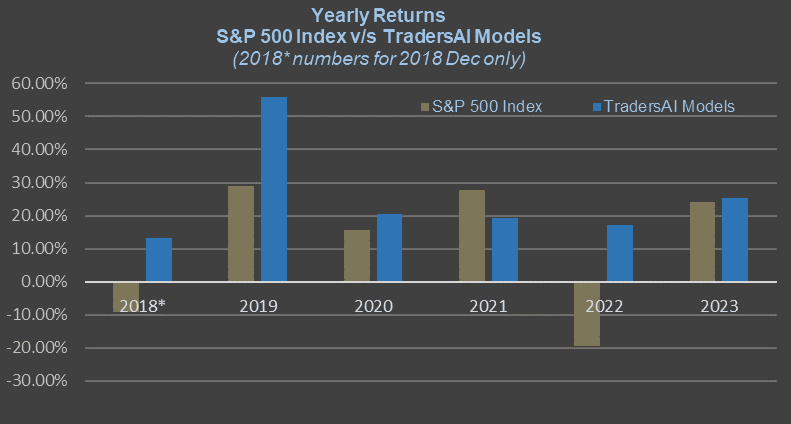
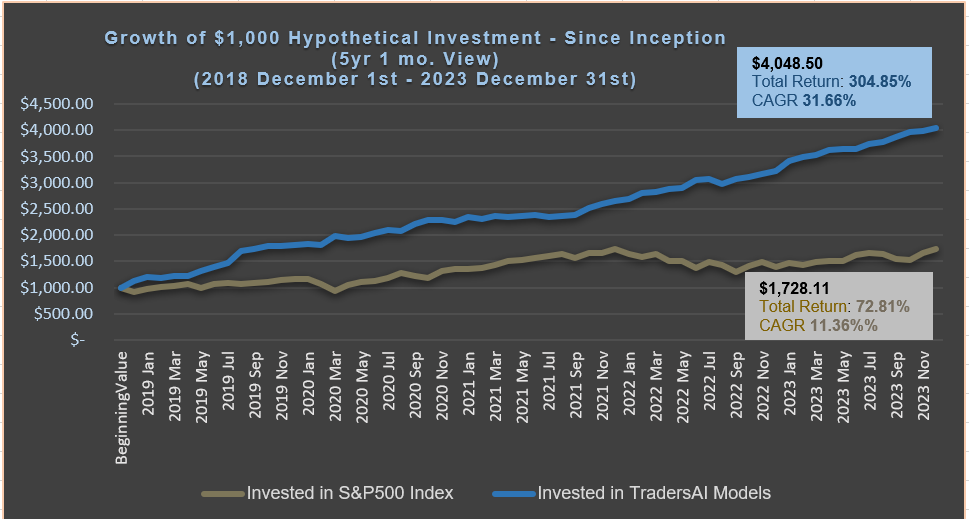
Those who followed our intraday models should have made handsome profits last week. For Monday, the aggressive/intraday models indicate indeterminate bias between 2737-2720 – stay flat between these levels. Above 2737, long bias with very tight stops/trailing stops (5 to 8 points, to make sure the models don’t get whipsawed in false spikes). Below 2720, short bias with a trailing stop of 8 points. If short and if the index falls below 2690, increase the trailing stop to 12 points and let the position ride or the stop get hit for a profit.
IMPORTANT NOTICES & DISCLAIMERS – READ CAREFULLY:
(i) This article contains personal opinions of the author and is NOT representative of any organization(s) he may be affiliated with. This article is solely intended for informational and educational purposes only. It is NOT any specific advice or recommendation or solicitation to purchase or sell or cause any transaction in any specific investment instruments at any specific price levels, but it is a generic analysis of the instruments mentioned.
(ii) Do NOT make your financial investment or trading decisions based on this article; anyone doing so shall do so solely at their own risk. The author will NOT be responsible for any losses or loss of potential gains arising from any investments/trades made based on the opinions, forecasts or other information contained in this article.
(iii) Risk Warning: Investing, trading in S&P 500 Index – spot, futures, or options or in any other synthetic form – or its component stocks carries inherent risk of loss. Trading in leveraged instruments such as futures carries much higher risk of significant losses and you may lose m
ore than you invested in them. Carefully consider your individual financial situation and investment objectives before investing in any financial instruments. If you are not a professional trader, consult a professional investment advisor before making your investment decisions.
ore than you invested in them. Carefully consider your individual financial situation and investment objectives before investing in any financial instruments. If you are not a professional trader, consult a professional investment advisor before making your investment decisions.
(iv) Past performance: This article may contain references to past performance of hypothetical trades or past forecasts, which should NOT be taken as any representation or promise or guarantee of potential future profits. Past performance is not indicative of future performance.
(v) The author makes no representations whatsoever and assumes no responsibility as to the suitability, accuracy, completeness or validity of the information or the forecasts provided.
(vi) All opinions expressed herein are subject to change at any time, without any notice to anyone.


