How Much did the S&P 500 Index Move Last Week? +0.65 points!!
Despite the headline grabbing market moves throughout last week, the S&P 500 Index moved just +0.65 points all of last week – from the close at 2767.13 on Friday, 10/12 to the close at 2767.78 on Friday, 10/19! This is in spite of all the “the bottom is falling off of the markets” kind of frenzied wild gyrations and media headlines in the markets last week!
This is significant in two ways:
(i) There were wild negative moves in the markets last week, driven by a myriad of apparent reasons including earnings, geopolitical news headlines, and the sharp drop the week before. All the “doom and gloom” scenarios could NOT really end up denting the markets to any extent last week!
(ii) Not only that the market did not go down for the week despite all the “crash is coming” predictions in the media and by the talking heads on the TV, the S&P 500 Index indeed ended the week up, albeit a meager 0.65 points!
This indicates potential stabilizing and a “base formation” for the markets, following the deep losses in the week prior on the 10th and 11th of October. Where it goes from here is dependent upon how the earnings season unfolds this week.
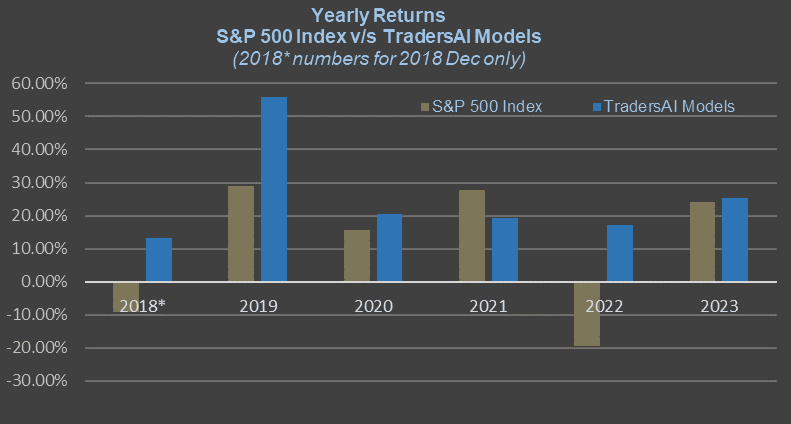
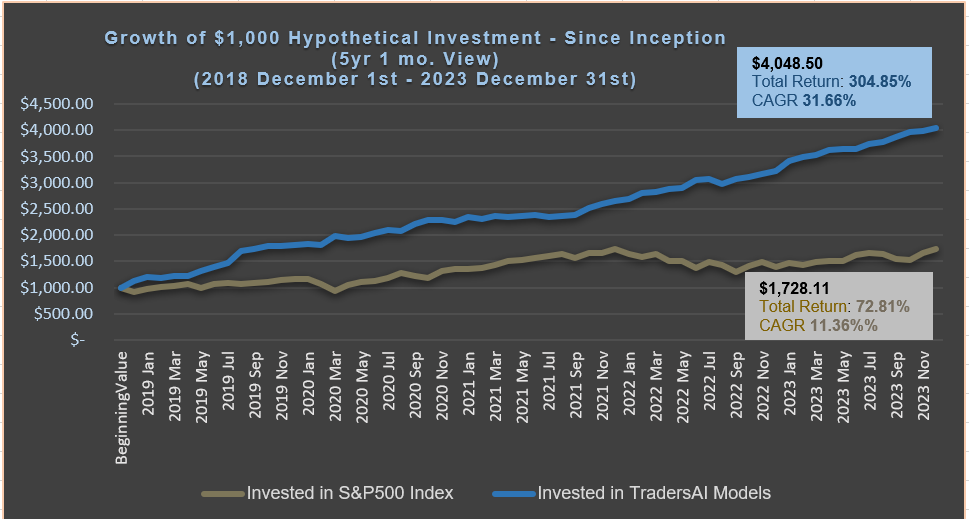
In the mean time, our models continue to churn out winning trade after winning trade in this volatile, choppy markets, with forecasts and trading levels given publicly before the market opens each trading day! Thank you to all the faithful followers who are reaching out with appreciation. Stay patient, stay safe and do not force a trade – let the models’ key levels given from day to day guide your trading decisions.
Model Biases/Outlook:
Due to the fact that the index has been flirting with the highly critical technical support level of the 200-DMA currently around 2767 over the last few trading sessions, our models are currently in an indeterminate state and would make further directional bias determination based on a decisive market action around this level.
Considering the ongoing earnings season, this clarity is likely to develop in the markets within these couple of weeks, only after which can there be a directional bias embraced by our medium-term models. This is applicable within the broadened range of 2818-2758 for a daily close.
Our aggressive intraday models would continue to indicate key trading levels on a day-to-day basis in the sections below.
A Brief Trace Back of The Current Bias/Outlook
Thursday, 09/27, our models had negated the previously adopted bullish bias and signaled a neutral bias between 2933 and 2887, which was later updated to 2920 and 2880.
On a break below 2880 on 10/10/18, our models executed the pre-published trading plan to book 142 points in profit on a short position! Our models have since adopted a “cautiously bearish” bias. This caution is in view of potential spikes up in a whipsaw mode.
With the sharp whipsaw moves in both directions with no real movement since Friday 10/12, our models are currently sporting an “indeterminate” bias.
Trading Plans for MON, 10/22:
Medium-term/long-term Investors
Following big wins during the volatile deep moves this month, the medium-term models are currently flat and sporting an indeterminate bias.
For today, Monday 10/22, the medium-term models indicate going long on a break above 2818 with a 8-point trailing stop and going short on a break below 2758 with an 8-point trailing stop.
Aggressive, Short-term, Intraday, or Professional Traders
Our aggressive intraday models closed a short position with a whopping 142+ points profit during the sharp drop in the markets the week ending 10/13/18! This was followed by a couple more big wins, despite the market not really moving much farther from the close of last Friday, 10/12!
For the last trading session, the models bagged yet another winning trade where the forecast published before the markets stated: “For today, Friday 10/19, the aggressive intraday models indicate going long above a break of 2783, with a 5-point trailing stop, and going short below a break of 2753, with a 7-point trailing stop” (click here to read the full report and/or verify this claim).
The index crossed the 2783 level in the first ten minutes, triggering a long position with the 5-point trailing stop. The session high was registered at 2797.77 within the next fifteen minutes, anchoring the trailing stop at 2792.77, which was later hit closing the long position for a profit of 9.77 points on the index! The models then stayed flat for the rest of the session.
For today, Monday 10/22, the aggressive intraday models indicate going long above 2791 with a 7-point trailing stop, and goinng short below 2764 with a 6-point trailing stop.
Remember that a “trailing stop” works differently from the traditional stop-loss order. Please bear in mind that the trailing stop’s trigger level would keep changing throughout the session (click here to read on the conceptual workings of a trailing-stop).
IMPORTANT RISK DISCLOSURES AND NOTICES – READ CAREFULLY:
(ii) Do NOT make your financial investment or trading decisions based on this article; anyone doing so shall do so solely at their own risk. The author will NOT be responsible for any losses or loss of potential gains arising from any investments/trades made based on the opinions, forecasts or other information contained in this article.
(iii) Risk Warning: Investing, trading in S&P 500 Index – spot, futures, or options or in any other synthetic form – or its component stocks carries inherent risk of loss. Trading in leveraged instruments such as futures carries much higher risk of significant losses and you may lose more
than you invested in them. Carefully consider your individual financial situation and investment objectives before investing in any financial instruments. If you are not a professional trader, consult a professional investment advisor before making your investment decisions.
(iv) Past performance: This article may contain references to past performance of hypothetical trades or past forecasts, which should NOT be taken as any representation or promise or guarantee of potential future profits. Past performance is not indicative of future performance.
(v) The author makes no representations whatsoever and assumes no responsibility as to the suitability, accuracy, completeness or validity of the information or the forecasts provided.
(vi) All opinions expressed herein are subject to change at any time, without any notice to anyone.


