The Market Mountain Goat…How Long Can It Keep Jumping From Peak to Peak?
Barely two sessions ago the news headlines were all about markets “tanking” and now the S&P 500 Index futures #ES is registering a new intermediate peak above the May 14th high of the index at 2742.10 (the futures registered an overnight high of 2746.75)! We have to go back to March 16th for the prior session where the index was above this level (High: 2761.85 and Close: 2752.01).
If you step back a little and consider that despite last week’s significant news flows and the sell-off in the markets, the S&P 500 ended the week comfortably in the bulls’ territory, AND the fact that the index did NOT fall through the strong support band (2710-2700) which we mentioned in our outlook published last Wednesday night, you hopefully would not think of short selling this market – not as long as it is above the 2710 level we referenced numerous times so far.
Model Biases/Outlook:
Having risen back above our repeatedly mentioned strong support band of 2710-2700 last week’s market action is interpreted by our models as another consolidation of the bulls’ strength. The market appears to be comfortably and nimbly galloping in the bulls’ land.
Anyone feeling tempted to short sell the market (“overvalued”, “overstretched”) has to note that the market had NOT entered the bears’ territory, even with last Tuesday’s and Thursday’s bearish action following the Italy’s political drama and then the renewed trade war fears. As mentioned in our intraday alert last week on 5/22, “2680 has to be broken for the models to turn bearish”. That forecast published 13 days back still holds true for the medium term models.
Trading Plans for Monday, 06/04/2018:
Medium-to-long term investors
Today’s action – noteworthy in that it pushed the S&P 500 Index below its 100 DMA – keeps the index within the strong support band and “still in bulls’ territory” range of our medium term models. Considering that this is a Friday, and keeping in view the heightened risk for geopolitical drama unfolding over the weekend, medium term models indicate staying flat by the end of the Friday’s session.
As per the Trading Plan published in last Friday’s Outlook, the medium term models ended the Friday flat and are currently flat as the index closed 0.38 points below our mentioned “stay flat” band of 2735-2700! The models indicate no short bias until at least a daily close below 2700 (slightly bearish) or below 2675 (outright bearish). In either case, medium term models indicate staying flat within the 2735-2700 band. Models indicate waiting for the day’s close to determine further entry points for a buy.
Aggressive, short term, intraday, or professional traders
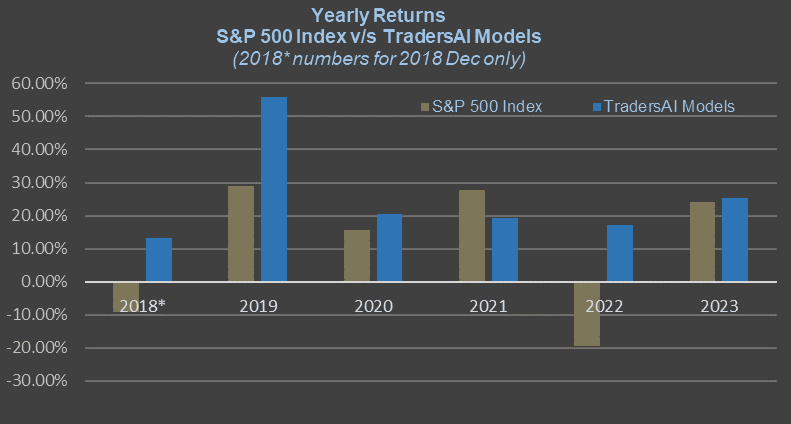
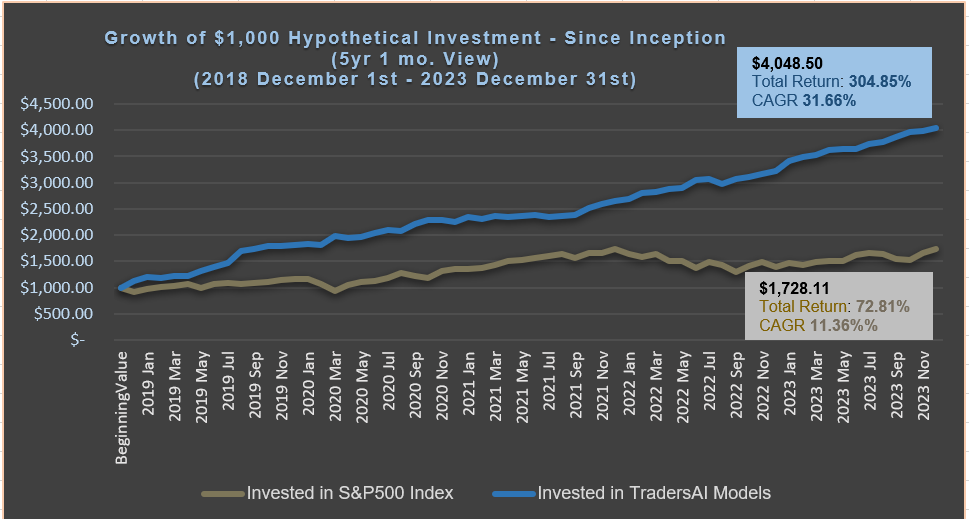
Those who followed our aggressive, short term models have done very well last week with multiple profitable trades and ended the week flat!
Our Friday’s forecast published Thursday night stated: “Bulls have to push the index into the 2730-35 region and clear above 2740 to keep the bullish move going…”, and the market did indeed pushed the index into the 2730-35 region, closing Friday at 2734.62! Added to that, the overnight futures market has already cleared the 2740 (overnight high registered at 2746.75), confirming the strength of the bull! Nevertheless, how much of this move will continue into and sustain through the regular session remains to be seen.
Aggressive, intraday models indicate trading from the long side while above 2730 and from the short side while below 2715 with tight stops (as small as 5 to 10 points). Stay flat between 2730 and 2715. Remember that we are in clear bulls’ territory and caution should be exercised when selling short.
IMPORTANT NOTICES & DISCLAIMERS – READ CAREFULLY:
(i) This article contains personal opinions of the author and is NOT representative of any organization(s) he may be affiliated with. This article is solely intended for informational and educational purposes only. It is NOT any specific advice or recommendation or solicitation to purchase or sell or cause any transaction in any specific investment instruments at any specific price levels, but it is a generic analysis of the instruments mentioned.
(ii) Do NOT make your financial investment or trading decisions based on this article; anyone doing so shall do so solely at their own risk. The author will NOT be responsible for any losses or loss of potential gains arising from any investments/trades made based on the opinions, forecasts or other information contained in this article.
(iii) Risk Warning: Investing, trading in S&P 500 Index – spot, futures, or options or in any other synthetic form – or its component stocks carries inherent risk of loss. Trading in leveraged instruments such as futures carries much higher risk of significant losses and you may lose more than you invested in them. Carefully consider your individual financial situation and investment objectives before investing in any financial instruments. If you are not a professional trader, consult a professional investment advisor before making your investment decisions.
(iv) Past performance: This article may contain references to past performance of hypothetical trades or past forecasts, which should NOT be taken as any representation or promise or guarantee of potential future profits. Past performance is not indicative of future performance.
(v) The author makes no representations whatsoever and assumes no responsibility as to the suitability, accuracy, completeness or validity of the information or the forecasts provided.
(vi) All opinions expressed herein are subject to change at any time, without any notice to anyone.


