Today In the Markets – Tue 08/15

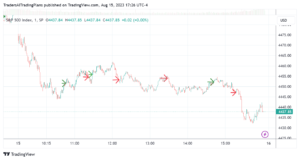
THE GIST (“THE WHAT”) The S&P 500 index broke below its 50-day moving average, a closely watched gauge of momentum, for the first time since March, led by weakness in bank stocks. Losses accelerated during the last hour of the session alongside rising yields. The index closed the session near day’s lows at 4437.85, down (more…)

S&P 500 MODEL TRADING PLANS FOR TUE 08/15 – RESULTS

Results of Published Model Trades for Tue 08/15 Find below the detailed outcome tracking of our models’ trading plans for the day, as well as the results for the last month. The horizontal lines on the chart show the price levels corresponding to the trading plans as published in the morning. (Please click here to (more…)

Trading Plans for TUE. 08/15: Back to the Basics, and the Reality?

S&P 500 INDEX MODEL TRADING PLANS for TUE. 08/15 Our trading plans published yesterday stated: “The level of 4495-4505 is now the immediate key level for both Support and Resistance. 4445-4452 is the next support level, a daily close below which will turn our models cautiously bearish”. This support level is tested on the index (more…)