Results of Published Model Trades for THU. 07/07 Find below the detailed outcome tracking of our models’ trading plans for the day, as well as the results for the last month. The horizontal lines on the chart show the price levels corresponding to the trading plans as published in the morning. (Please click here to (more…)
Our Key Level is Again in Play – Day 2 After breaking through the 3793 level we published for the last few days, the index is now rushing to test the 3855 level our models have been talking about multiple times in the last few weeks. This is the “20% down from the last peak” (more…)
Results of Published Model Trades for WED. 07/06 Find below the detailed outcome tracking of our models’ trading plans for the day, as well as the results for the last month. The horizontal lines on the chart show the price levels corresponding to the trading plans as published in the morning. (Please click here to (more…)
Our Key Level is Again in Play On this FOMC Day After breaking through the 3793 level we published for the last few days, the index is now rushing to test the 3855 level our models have been talking about multiple times in the last few weeks. This is the “20% down from the last (more…)
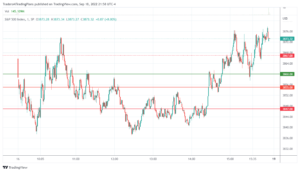
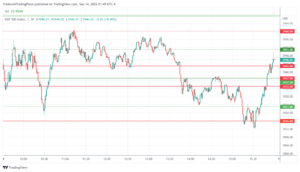
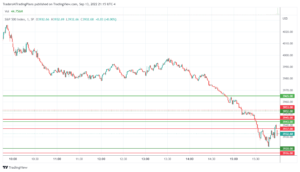
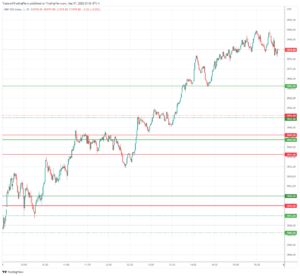
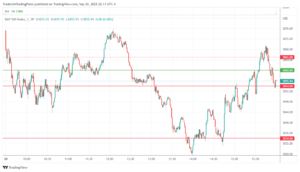
Results of Published Model Trades for TUE. 07/05 Find below the detailed outcome tracking of our models’ trading plans for the day, as well as the results for the last month. The horizontal lines on the chart show the price levels corresponding to the trading plans as published in the morning. (Please click here to (more…)
Inflation Fears leading to Recession Scares As we stated in our trading plans on Thursday, 06/30 morning: “the index is now testing a key range of 3765-3793”. This range was breached that day but the index climbed back up. This range is in play again this morning. If the index registers a daily close below (more…)
Results of Published Model Trades for FRI. 07/01 Find below the detailed outcome tracking of our models’ trading plans for the day, as well as the results for the last month. The horizontal lines on the chart show the price levels corresponding to the trading plans as published in the morning. (Please click here to (more…)
The ISM Release to Set the Market Tone Next? As we stated in our trading plans yesterday morning: “the index is now testing a key range of 3765-3793”. This range was breached yesterday but the index climbed back up close, and is testing the upper limit approaching the session open. The ISM release at 10:00am (more…)
Results of Published Model Trades for THU. 06/30 Find below the detailed outcome tracking of our models’ trading plans for the day, as well as the results for the last month. The horizontal lines on the chart show the price levels corresponding to the trading plans as published in the morning. (Please click here to (more…)
Consolidation or Next Leg of Volatility? With the rejection of the 3950 level, and with the breakdown below 3855 level, the index is now testing a key range of 3765-3793. If a daily close above this range then it would indicate ongoing consolidation of the recent move up, but if a daily close below this (more…)