


Results of Published Model Entries and Exits for Monday 05/20
Find below the detailed outcome tracking of our models’ trading plans for the day, as well as the results for the last month:
NOTE: The index by itself is NOT tradable. The model plans here based on the S&P index level can be used to trade any instrument that tracks the index – the futures on the index (ES, ES-mini), the options on the futures (ES options), the SPX options, the ETF SPY are just a few examples of the instruments one can adapt these plans to.
These plans and results are hypothetical and NOT an investment advice to buy or sell any specific securities but are intended to aid – as informational, educational, and research tools – in arriving at your own investment/trading decisions. Please read the full disclosures at the bottom of this article for additional notes and disclaimers.
Trading Plans/Forecast Published Monday Morning – Medium-Frequency Models
“For today, Monday 05/20, our medium-frequency models indicate going long on a break above 2863, with a 10-point trailing stop. The models also indicate going short on a break below 2855, with a 10-point trailing stop and a short-exit on a break above at 2832 or 2845.”
Trading Plan Results/Outcome
Mon 05/20: No trades
The index registered a session high of 2853.86 – just about one point shy of the 2855 level to trigger a short on a break below. Consequently, there were no trades triggered by our medium frequency models for the day.
Past results this month – medium frequency models (hypothetical trades based on the trading plans published before markets open daily):
Trading Plans/Forecast Published Monday Morning – Aggressive Intraday Models
“For today, Monday 05/20, our aggressive intraday models indicate going short on a break below 2855 or 2846 – each with an 8-point trailing stop and a take-profit target of 2835 – and, going short on a break below 2828 with an 8-point trailing stop. Models also indicate going long on a break above 2858 or 2845 – each with an 8-point trailing stop and a take-profit target of 2868. “
Trading Plan Results/Outcome:
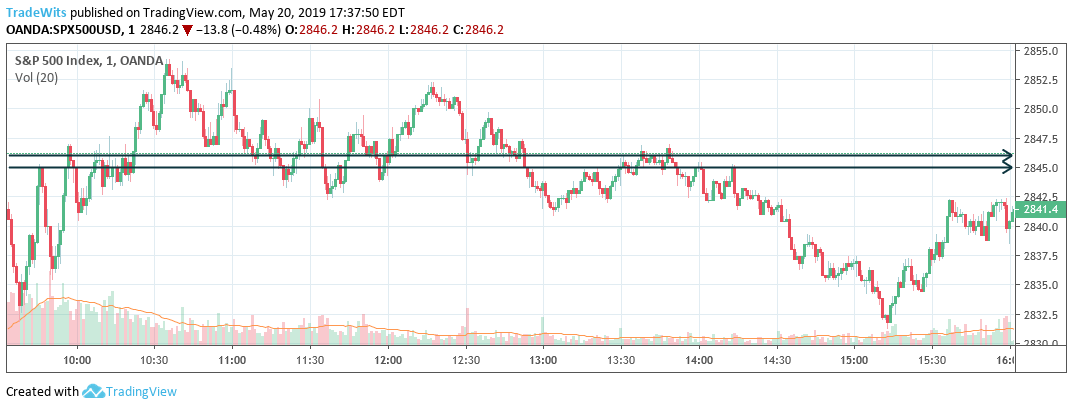
Mon 05/20: Our aggressive intraday models booked a net of +20.71 index points in gains on seven long trades and eight short trades. The total number of fifteen trades is unusually high and is indicative of the fierce battle between the bulls and the bears around the key 2840-2850 range.
The index broke below the 2846 level around 11:20am ET, triggering a short position with an 8-point trailing stop. The index crossed above the 2845 level within a few minutes, closing the short with a gain of 1.00 index points and simultaneously opening a long.
The index broke below the 2846 level around 11:35am, closing the long with a gain of 1.00 index points and simultaneously opening a short for the second time.
The index broke above the 2845 level in the next ten minutes – around 11:45am, closing the short with a gain of 1.00 index points and simultaneously opening a long for the second time.
The index broke below the 2846 level around 11:55am, closing the second long with a gain of 1.00 index points and simultaneously opening a short for the third time.
The index broke above the 2845 level within the next ten minutes, closing the short with a gain of 1.00 index points and simultaneously opening a long for the third time. The long reached an interim high of 2851.93 before breaking below 2846 around 12:30pm – closing it with a gain of 1.00 index points and simultaneously opening a short for the fourth time.
The fourth short was closed with a gain of 1.00 index points within the next five minutes on the index breaking above 2845, and simultaneously opened a long for the fourth time.
The fourth long was closed within the next few minutes with the index crossing below 2846 – around 12:50pm – with a gain of 1.00 index points, and simultaneously opening a short for the fifth time.
The fifth short was closed – with a gain of 1.00 index points – within the next few minutes on the index crossing above 2845 level, and simultaneously opened a long for the fifth time.
The long was closed – with a gain of 1.00 index points – within the next couple of minutes on the index crossing below the 2846 level, and simultaneously opened a short for the sixth time.
The short was closed – with a gain of 1.00 index points – on the index crossing above the 2845 level around 1:40pm, and simultaneously opened a long for the sixth time.
Within the next ten minutes, with the choppy action around the 2845-2846 level, the models opened and closed two longs and one short – each one with a gain of 1.00 index points – and the eighth short opened around 1:50pm.
The eighth short rode all the way down to the session low of 2831.29 – reached around 3:15pm – and set the stop trigger to 2839.29. This stop was hit around 3:35pm, closing the short with a gain of 6.71 index points. The models stayed flat for the rest of the session.
Thus, in a choppy price action around the identified 2845-2846 level, our aggressive intraday models made seven long trades with a gain of 1.00 index points each, and eight short trades with a total gain of 13.71 index points, for a net total gain of 20.71 index points on a total of fifteen trades. The unusually high number of trades is indicative of indecision in the markets as well as the lack of weakness on the part of the bulls even in the face of the trade-war related noise reaching a crescendo.
Past results this month – aggressive intraday models (hypothetical trades based on the trading plans published before markets open daily):
(i) This and other articles in the blog contain personal opinions of the author and is NOT representative of any organization(s) he may be affiliated with. This article is solely intended for informational and educational purposes only. It is NOT any specific advice or recommendation or solicitation to purchase or sell or cause any transaction in any specific investment instruments at any specific price levels, but it is a generic analysis of the instruments mentioned.
(ii) Do NOT make your financial investment or trading decisions based on this article; anyone doing so shall do so solely at their own risk. The author will NOT be responsible for any losses or loss of potential gains arising from any investments/trades made based on the opinions, forecasts or other information contained in this article.
(iii) Risk Warning: Investing, trading in S&P 500 Index – spot, futures, or options or in any other synthetic form – or its component stocks carries inherent risk of loss. Trading in leveraged instruments such as futures carries much higher risk of significant losses and you may lose more than you invested in them. Carefully consider your individual financial situation and investment objectives before investing in any financial instruments. If you are not a professional trader, consult a professional investment advisor before making your investment decisions.
(iv) Past performance: This article may contain references to past performance of hypothetical trades or past forecasts, which should NOT be taken as any representation or promise or guarantee of potential future profits. Past performance is not indicative of future performance.
(v) The author makes no representations whatsoever and assumes no responsibility as to the suitability, accuracy, completeness or validity of the information or the forecasts provided.
(vi) All opinions expressed herein are subject to change at any time, without any notice to anyone