


Results of Published Model Entries and Exits for Monday 06/03
Find below the detailed outcome tracking of our models’ trading plans for the day, as well as the results for the last month:
NOTE: The index by itself is NOT tradable. The model plans here based on the S&P index level can be used to trade any instrument that tracks the index – the futures on the index (ES, ES-mini), the options on the futures (ES options), the SPX options, the ETF SPY are just a few examples of the instruments one can adapt these plans to.
These plans and results are hypothetical and NOT an investment advice to buy or sell any specific securities but are intended to aid – as informational, educational, and research tools – in arriving at your own investment/trading decisions. Please read the full disclosures at the bottom of this article for additional notes and disclaimers.

Trading Plans/Forecast Published Monday Morning – Medium-Frequency Models
“For today, Monday 06/03, our medium-frequency models indicate going short on a break below 2735 with a 10-point trailing stop and a short-exit on a break above 2725 or 2730. Models also indicate going long on a break above 2755 with an 8-point trailing stop and a long-exit on a break below 2750 or 2760”
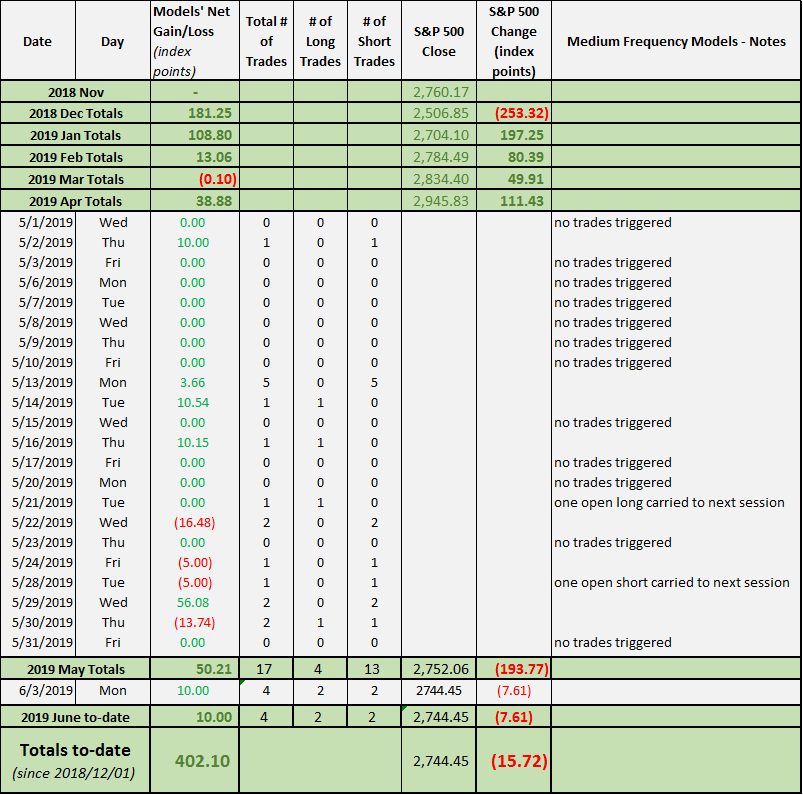
Fri 05/31: The medium-frequency models booked a net +10.00 index points in gains on two longs and two shorts.
The index broke above the 2755 level within the first couple of minutes, triggering a long position. The long then reached an interim high of 2759.63 (just 0.37 points to reach out 2760 level) in the next few minutes before retreating. The index broke the 2750 level around 9:45am ET, closing the long with a loss of 5.00 index points.
The index broke above the 2755 level for a second time around 10:25am, triggering a long position (#2). The long then rode to an interim high above 2760.00 before breaking below 2760.00 around 10:35am, closing the long with a gain of 5.00 index points.
The index broke below the 2735 level around 3:05pm, triggering a short. The short then reached an interim low of 2729.83 around 3:10pm, and then broke above 2730, closing the short with a gain of 5.00 index points.
The index broke below the 2735 level again around 3:25pm, triggering another short (#2). The short rode down to the session low of 2728.81 around 3:35pm and then broke above the 2730 level, closing the position with a gain of 5.00 index points. The models stayed flat for the rest of the session.
Thus, the models registered a total gain of 10.00 index points (-5.00 +5.00 +5.00 +5.00) on two longs and two shorts.
Past results this month – medium frequency models (hypothetical trades based on the trading plans published before markets open daily):
Trading Plans/Forecast Published Friday Morning – Aggressive Intraday Models
“For today, Monday 06/03, our aggressive intraday models indicate going long on a break above 2760 or 2750 or 2745 with an 8-point trailing stop, with a long-exit on a break below 2755 or 2760 or 2773. Models also indicate going short on a break below 2743 with an 6-point trailing stop and a short-exit on a break above 2740 or 2736. In addition, models also indicate going short on a break below 2734 with a 6-point trailing stop.”
Trading Plan Results/Outcome:
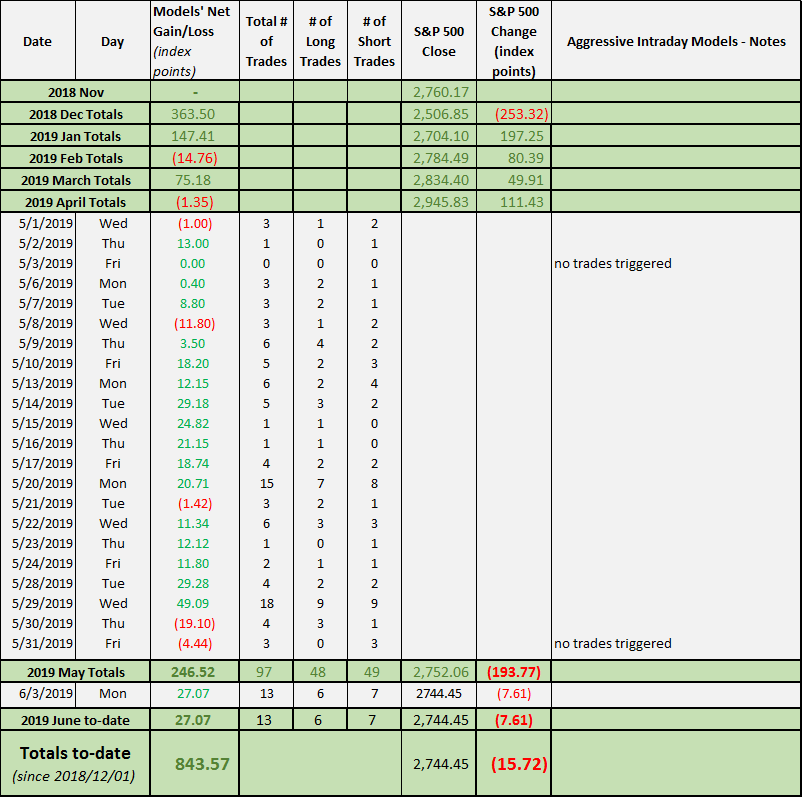
Fri 05/31: Aggressive intraday models booked a net of +27.07 index points in gains on a total of six longs and seven shorts.
The index broke above the 2845 level around 10:00am, triggering a long. The index broke below the 2743 level within the next couple of minutes, closing the long with a loss of 2.00 index points and, simultaneously, opening a short.
The index broke above the 2760 level around 10:40am, triggering a long (#3) with an 8-point trailing stop. The long then rode to the session high of 2763.07 around 10:45am, lifting the trailing stop trigger to 2755.07, which was triggered around 11:15am closing the long with a loss of 4.93 index points.
The index broke above the 2750 level around 12:00pm, triggering another long (#4). The index then fell breaking below the 2743 level around 12:15pm, closing the long with a loss of 7.00 index points, and simultaneously opening a short (#2).
The short then rode below the short-exit level of 2736 and then broke above it around 12:35pm, closing the position with a gain of 7.00 index points.
The index broke below the 2743 level again around 1:20pm, triggering another short (#3) with a 6-point trailing stop. The short reached an interim low of 2739.66 in the next few minutes, dragging the trailing stop trigger to 2745.66. However, the long-entry level of 2745 was triggered around 1:25pm, closing the short with a loss of 2.00 index points, and simultaneously opening a long (#5).
The long reached an interim high of 2755.70 – above the long-exit level of 2755 – before falling below it and closing at 2750.17, thus closing the long at 2755 for a gain of 10.00 index points (if you were trading on a 1-minute resolution, the close would be at the 1-minute bar close of 2750.17, resulting in a gain of 5.17 index points; on other time-frames, your results could be totally different).
The index then broke below the 2743 level around 1:30pm, triggering another short (#4). The short rode below the 2736 level and then broke above it, closing the position with a gain of 7.00 index points.
The index broke below the 2743 level again around 1:50pm, triggering another short (#5). This short was closed around 2:00pm when the index broke above the long entry level of 2745, thus booking a loss of 2.00 index points and, simultaneously, opening a long (#6).
The long reached an interim high of 2752.41 before falling below the short-entry level of 2743 around 2:40pm. The long was closed with a loss of 2.00 index points, and a short (#6) was opened simultaneously.
The short rode down to an interim low of 2729.83 and then crossed above the short-exit level of 2736 thus closing the position with a gain of 7.00 index points.
The index broke below the 2734 level again around 3:30pm, triggering another short (#7). This short reached the session low of 2728.81 within a few minutes before rising and breaking above the short-exit level of 2736 at 3:45pm and closing the position with a loss of 2.00 index points. The models stayed flat for the rest of the session.
Past results this month – aggressive intraday models (hypothetical trades based on the trading plans published before markets open daily):
(i) This and other articles in the blog contain personal opinions of the author and is NOT representative of any organization(s) he may be affiliated with. This article is solely intended for informational and educational purposes only. It is NOT any specific advice or recommendation or solicitation to purchase or sell or cause any transaction in any specific investment instruments at any specific price levels, but it is a generic analysis of the instruments mentioned.
(ii) Do NOT make your financial investment or trading decisions based on this article; anyone doing so shall do so solely at their own risk. The author will NOT be responsible for any losses or loss of potential gains arising from any investments/trades made based on the opinions, forecasts or other information contained in this article.
(iii) Risk Warning: Investing, trading in S&P 500 Index – spot, futures, or options or in any other synthetic form – or its component stocks carries inherent risk of loss. Trading in leveraged instruments such as futures carries much higher risk of significant losses and you may lose more than you invested in them. Carefully consider your individual financial situation and investment objectives before investing in any financial instruments. If you are not a professional trader, consult a professional investment advisor before making your investment decisions.
(iv) Past performance: This article may contain references to past performance of hypothetical trades or past forecasts, which should NOT be taken as any representation or promise or guarantee of potential future profits. Past performance is not indicative of future performance.
(v) The author makes no representations whatsoever and assumes no responsibility as to the suitability, accuracy, completeness or validity of the information or the forecasts provided.
(vi) All opinions expressed herein are subject to change at any time, without any notice to anyone