

")


Results of Published Model Entries and Exits for Thursday 05/30
Note that the choppiness of today’s market action has manifested itself in the excessive number of trades by our aggressive intraday models!
Find below the detailed outcome tracking of our models’ trading plans for the day, as well as the results for the last month:
NOTE: The index by itself is NOT tradable. The model plans here based on the S&P index level can be used to trade any instrument that tracks the index – the futures on the index (ES, ES-mini), the options on the futures (ES options), the SPX options, the ETF SPY are just a few examples of the instruments one can adapt these plans to.
These plans and results are hypothetical and NOT an investment advice to buy or sell any specific securities but are intended to aid – as informational, educational, and research tools – in arriving at your own investment/trading decisions. Please read the full disclosures at the bottom of this article for additional notes and disclaimers.
Trading Plans/Forecast Published Thursday Morning – Medium-Frequency Models
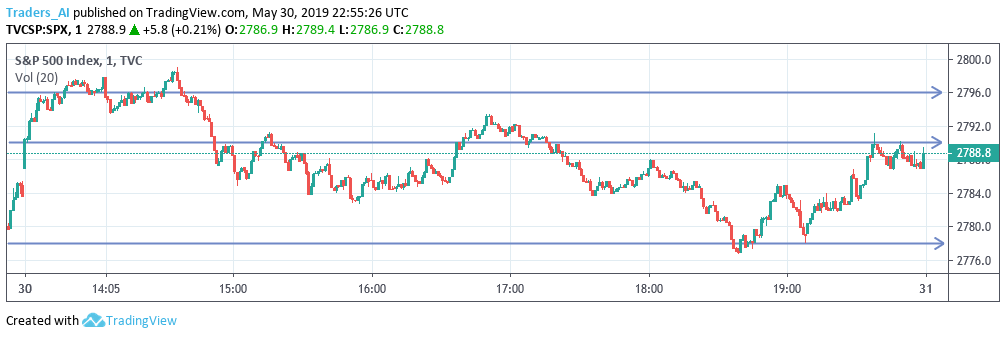
“For today, Thursday 05/30, our medium-frequency models indicate going long on a break above 2796 with a 7-point trailing stop, and going short on a break below 2778 with a 10-point trailing stop.
Trading Plan Results/Outcome
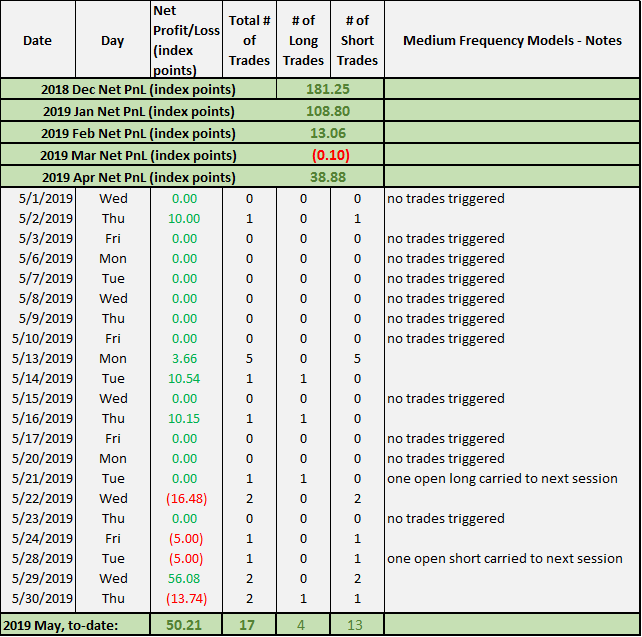
Thu 05/30: The medium-frequency models booked a net of -13.74 index points in losses on one long and one short.
The index broke above the 2796 level around 9:50am ET, triggering a long with a 7-point trailing stop. The index reached the session high of 2799, lifting the trialing stop to 2791. The stop was triggered around 10:50am, closing the long with a loss of 5.00 index points.
The index broke below the 2778 level around 2:35pm, triggering a short with a 10-point trailing stop. The index reached the session low of 2776.74, lowering the stop to 2786.74. This stop was triggered around 3:35pm, closing the short with a loss of 8.74 index points. The models stayed flat for the rest of the session.
Thus, the medium-frequency models booked a net of 13.74 in losses for the day.
Past results this month – medium frequency models (hypothetical trades based on the trading plans published before markets open daily):
Trading Plans/Forecast Published Thursday Morning – Aggressive Intraday Models
“For today, Thursday 05/30, our aggressive intraday models indicate going long on a break above 2790, 2772, or 2768 with an 8-point trailing stop. Models also indicate going short on a break below 2778, 2770, or 2765 with a 10-point trailing stop.“
Trading Plan Results/Outcome:
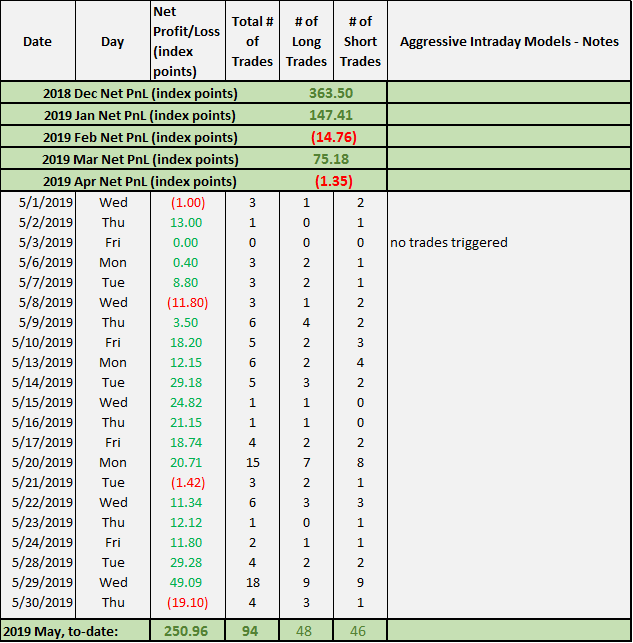
Thu 05/30: The aggressive intraday models booked a net -19.10 index points in losses on three longs and one short.
The index broke above the 2790 level within the first couple of minutes, triggering a long with an 8-point trailing stop. The long reached the session high of 2799 around 10:35am, lifting the trailing stop to 2791, which was triggered around 10:50am closing the long with a gain of 1.00 index points.
The index broke above the 2790 a second time around 11:15am, triggering the second long position of the day, with an 8-point trailing stop. The long reached an interim high of 2791.28 within the next couple of minutes, lifting the stop to 2783.28, which was triggered around 11:55am closing the long with a loss of 6.72 index points.
The index broke above the 2790 level again around 12:40pm, triggering the third long of the day. The long reached an interim high of 2793.36 around 12:50pm, lifting the trailing stop to 3785.36. This stop was triggered around 1:35pm, closing the long with a loss of 4.64 index points.
The index broke below the 2778 level around 2:35pm, triggering a short with a 10-point trailing stop. The short reached an interim low of 2776.74, lowering the stop trigger to 2786.74. This stop was triggered around 3:30pm, closing the short with a loss of 8.74 index points. The models stayed flat for the rest of the session.
Thus, the aggressive intraday models booked a net loss of 19.10 index points (+1.00 -6.72 -4.64 -8.74) for the day.
Past results this month – aggressive intraday models (hypothetical trades based on the trading plans published before markets open daily):
(i) This and other articles in the blog contain personal opinions of the author and is NOT representative of any organization(s) he may be affiliated with. This article is solely intended for informational and educational purposes only. It is NOT any specific advice or recommendation or solicitation to purchase or sell or cause any transaction in any specific investment instruments at any specific price levels, but it is a generic analysis of the instruments mentioned.
(ii) Do NOT make your financial investment or trading decisions based on this article; anyone doing so shall do so solely at their own risk. The author will NOT be responsible for any losses or loss of potential gains arising from any investments/trades made based on the opinions, forecasts or other information contained in this article.
(iii) Risk Warning: Investing, trading in S&P 500 Index – spot, futures, or options or in any other synthetic form – or its component stocks carries inherent risk of loss. Trading in leveraged instruments such as futures carries much higher risk of significant losses and you may lose more than you invested in them. Carefully consider your individual financial situation and investment objectives before investing in any financial instruments. If you are not a professional trader, consult a professional investment advisor before making your investment decisions.
(iv) Past performance: This article may contain references to past performance of hypothetical trades or past forecasts, which should NOT be taken as any representation or promise or guarantee of potential future profits. Past performance is not indicative of future performance.
(v) The author makes no representations whatsoever and assumes no responsibility as to the suitability, accuracy, completeness or validity of the information or the forecasts provided.
(vi) All opinions expressed herein are subject to change at any time, without any notice to anyone