

")


Results of Published Model Entries and Exits for Wednesday 05/29
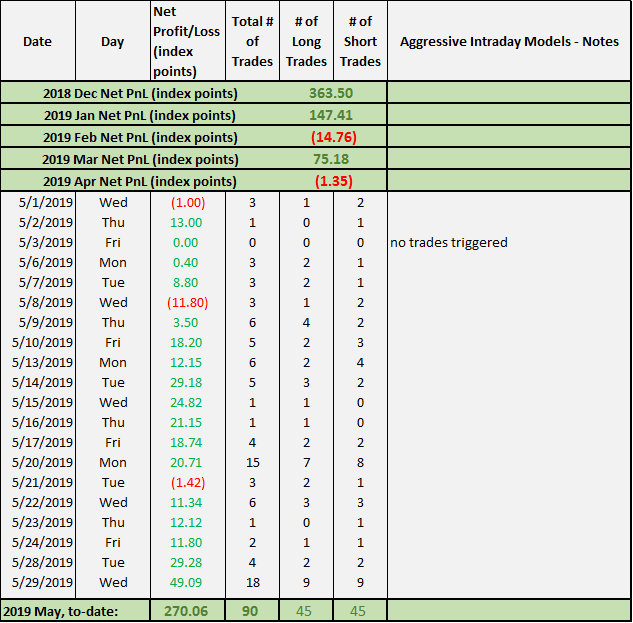
Note that the choppiness of today’s market action has manifested itself in the excessive number of trades by our aggressive intraday models!
Find below the detailed outcome tracking of our models’ trading plans for the day, as well as the results for the last month:
NOTE: The index by itself is NOT tradable. The model plans here based on the S&P index level can be used to trade any instrument that tracks the index – the futures on the index (ES, ES-mini), the options on the futures (ES options), the SPX options, the ETF SPY are just a few examples of the instruments one can adapt these plans to.
The trades given below are not reflective of or indicative of any specific outcomes for any specific individual – your exact results would vary widely, depending on the time frame you use – tick chart, 1-min chart, 5-min chart, 15-min chart etc, as well as the quality of the execution of your broker, the stop levels you use based on your risk tolerance and your trading style.
These plans and results are hypothetical and NOT an investment advice to buy or sell any specific securities but are intended to aid – as informational, educational, and research tools – in arriving at your own investment/trading decisions. Please read the full disclosures at the bottom of this article for additional notes and disclaimers.
Trading Plans/Forecast Published Wednesday Morning – Medium-Frequency Models
“For today, Wednesday 05/29, our medium-frequency models are carrying an open short from yesterday – opened at 2825, with a 10-point trailing stop anchored at 2811.58 as of yesterday’s regular session close. Models indicate adjusting the trigger to 2795 and making the trailing stop a 6-point trail until the position is closed. Additionally, the short is indicated to be exited on a break above 2788.
Once flat, models indicate going short on a break below 2800 or 2790, with an 8-point trailing stop, and going long on a break above 2825 with an 10-point trailing stop.”
Trading Plan Results/Outcome
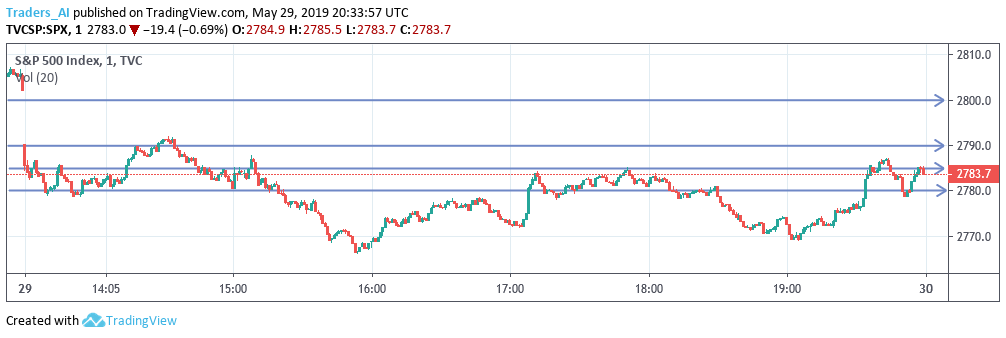
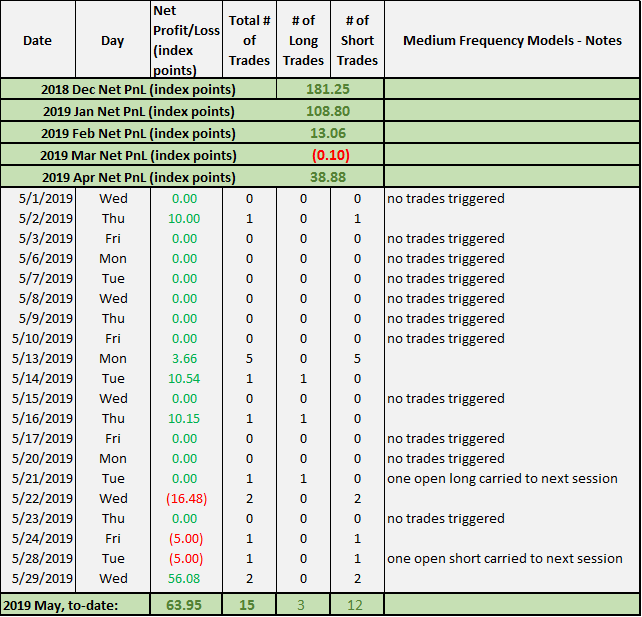
Wed 05/29: The medium-frequency models booked +56.08 index points in gains on two shorts
The index carried the short from yesterday to an interim low of 2778.86 reached around 9:40am ET, thereby taking the 6-point trailing stop to 2784.86. The stop was triggered within the next five minutes, closing the short with a gain of 40.14 index points!
The index broke below the 2790 level around 10:35am, triggering a short position with an 8-point trailing stop. The short then rode the index all the way down to the session low at 2766.06, reached around 11:55am, taking the trailing stop trigger to 2774.06. The stop was triggered around 12:15pm, closing the short with a gain of 15.94 index points. The models stayed flat for the rest of the session.
Past results this month – medium frequency models (hypothetical trades based on the trading plans published before markets open daily):
Trading Plans/Forecast Published Wednesday Morning – Aggressive Intraday Models
“For today, Wednesday 05/29, our aggressive intraday models indicate using 2785 as a pivot for both long and short trades; they would go long on a break above 2785 and go short on a break below 2785 – both sides with an 8-point trailing stop. Also, models indicate additional pivots at 2790 and 2780 for both long and short entries, with 8-point trailing stops. “
Trading Plan Results/Outcome:
Wed 05/29: The aggressive intraday models booked +49.09 index points in gains on a total of 18 trades (nine shorts and nine longs)
The index broke below the 2785 level within the first couple of minutes, triggering a short with an 8-point trailing stop. Within the next couple of minutes, this was closed on the index breaking above 2785, opening a long which was then closed within the next couple of minutes with the index breaking below 2785. Thus, within the first few minutes, the aggressive intraday models opened and closed one short and one long, and carried the second short forward.
Past results this month – aggressive intraday models (hypothetical trades based on the trading plans published before markets open daily):
(i) This and other articles in the blog contain personal opinions of the author and is NOT representative of any organization(s) he may be affiliated with. This article is solely intended for informational and educational purposes only. It is NOT any specific advice or recommendation or solicitation to purchase or sell or cause any transaction in any specific investment instruments at any specific price levels, but it is a generic analysis of the instruments mentioned.
(ii) Do NOT make your financial investment or trading decisions based on this article; anyone doing so shall do so solely at their own risk. The author will NOT be responsible for any losses or loss of potential gains arising from any investments/trades made based on the opinions, forecasts or other information contained in this article.
(iii) Risk Warning: Investing, trading in S&P 500 Index – spot, futures, or options or in any other synthetic form – or its component stocks carries inherent risk of loss. Trading in leveraged instruments such as futures carries much higher risk of significant losses and you may lose more than you invested in them. Carefully consider your individual financial situation and investment objectives before investing in any financial instruments. If you are not a professional trader, consult a professional investment advisor before making your investment decisions.
(iv) Past performance: This article may contain references to past performance of hypothetical trades or past forecasts, which should NOT be taken as any representation or promise or guarantee of potential future profits. Past performance is not indicative of future performance.
(v) The author makes no representations whatsoever and assumes no responsibility as to the suitability, accuracy, completeness or validity of the information or the forecasts provided.
(vi) All opinions expressed herein are subject to change at any time, without any notice to anyone