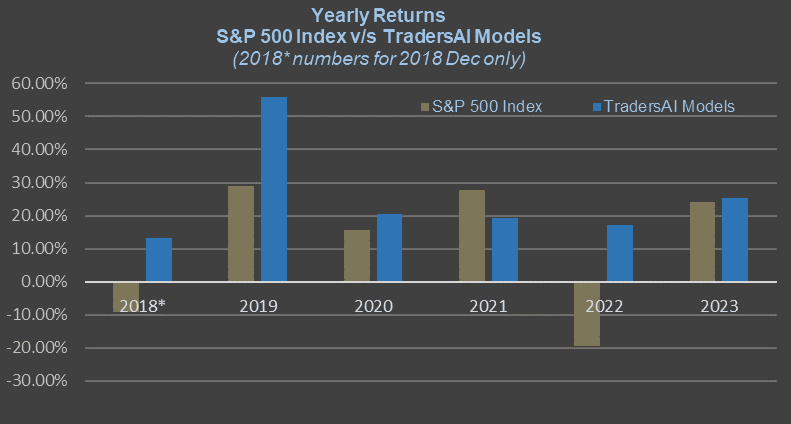
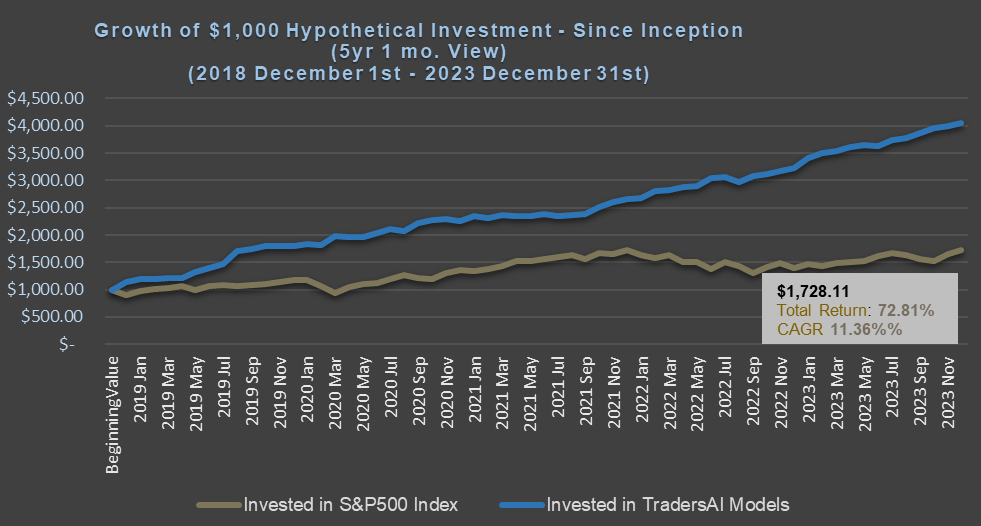
The Market Bull Sizing Up the Resistance Ahead
As mentioned in our
IntradayAlert published today, our models indicate that the 2740-50 band is now the critical resistance band for S&P 500 Index, which is going to hold the clue about the next directional bias of the market. The index registered the session high at 2749.16, could not pierce the 2750 today, and closed within this band at 2746.87. Below the current levels, there is the
strong support band (2710-2700) which we mentioned in our outlook published last Wednesday night.
Model Biases/Outlook:
Having risen back above our repeatedly mentioned strong support band of 2710-2700 in spite of the rocky geopolitical newsflow last week, the market appears to be comfortably and nimbly galloping in the bulls’ land. However, since it is trading within the strong resitsance band of 2750-40, caution should be exercised when trading from the long side.
As mentioned in our intraday alert last week on 5/22, “2680 has to be broken for the models to turn bearish”. That forecast published 14 days back still holds true for the medium term models.
Trading Plans for Monday, 06/04/2018:
Medium-to-long term investors
Medium term models are biased
against short selling, and are
cautious about opening fresh long buying. For Tuesday, the models indicate staying flat below 2753, and buying within 2753-55 range with tight stops.
The models indicate no short bias until at least a daily close below 2700 (slightly bearish) or below 2675 (outright bearish). In either case, medium term models indicate no new positions within the 2750-2700 band.
Aggressive, short term, intraday, or professional traders
Aggressive, intraday models indicate trading from the long side while above 2740 and from the short side while below 2730 with tight stops (as small as 5 to 10 points). Indeterminate between 2740 and 2730. Remember that we are in the bulls’ territory – caution should be exercised when selling short.
IMPORTANT NOTICES & DISCLAIMERS – READ CAREFULLY:
(i) This article contains personal opinions of the author and is NOT representative of any organization(s) he may be affiliated with. This article is solely intended for informational and educational purposes only. It is NOT any specific advice or recommendation or solicitation to purchase or sell or cause any transaction in any specific investment instruments at any specific price levels, but it is a generic analysis of the instruments mentioned.
(ii) Do NOT make your financial investment or trading decisions based on this article; anyone doing so shall do so solely at their own risk. The author will NOT be responsible for any losses or loss of potential gains arising from any investments/trades made based on the opinions, forecasts or other information contained in this article.
(iii) Risk Warning: Investing, trading in S&P 500 Index – spot, futures, or options or in any other synthetic form – or its component stocks carries inherent risk of loss. Trading in leveraged instruments such as futures carries much higher risk of significant losses and you may lose more than you invested in them. Carefully consider your individual financial situation and investment objectives before investing in any financial instruments. If you are not a professional trader, consult a professional investment advisor before making your investment decisions.
(iv) Past performance: This article may contain references to past performance of hypothetical trades or past forecasts, which should NOT be taken as any representation or promise or guarantee of potential future profits. Past performance is not indicative of future performance.
(v) The author makes no representations whatsoever and assumes no responsibility as to the suitability, accuracy, completeness or validity of the information or the forecasts provided.
(vi) All opinions expressed herein are subject to change at any time, without any notice to anyone.


